
Viewing analytics
Build a dashboard of charts and usage reports in PriApps CloudPrint, save it to use again, and download usage reports as CSV files.
Analytics shows your organization's printing, copying, scanning and faxing as charts and usage reports. You build your own dashboard from up to four of them, and you can save it for you and the other admins to use again.
Before you begin
- Sign in to the PriApps CloudPrint Console. See Signing in to the PriApps CloudPrint Console.
Build your dashboard
Open Analytics
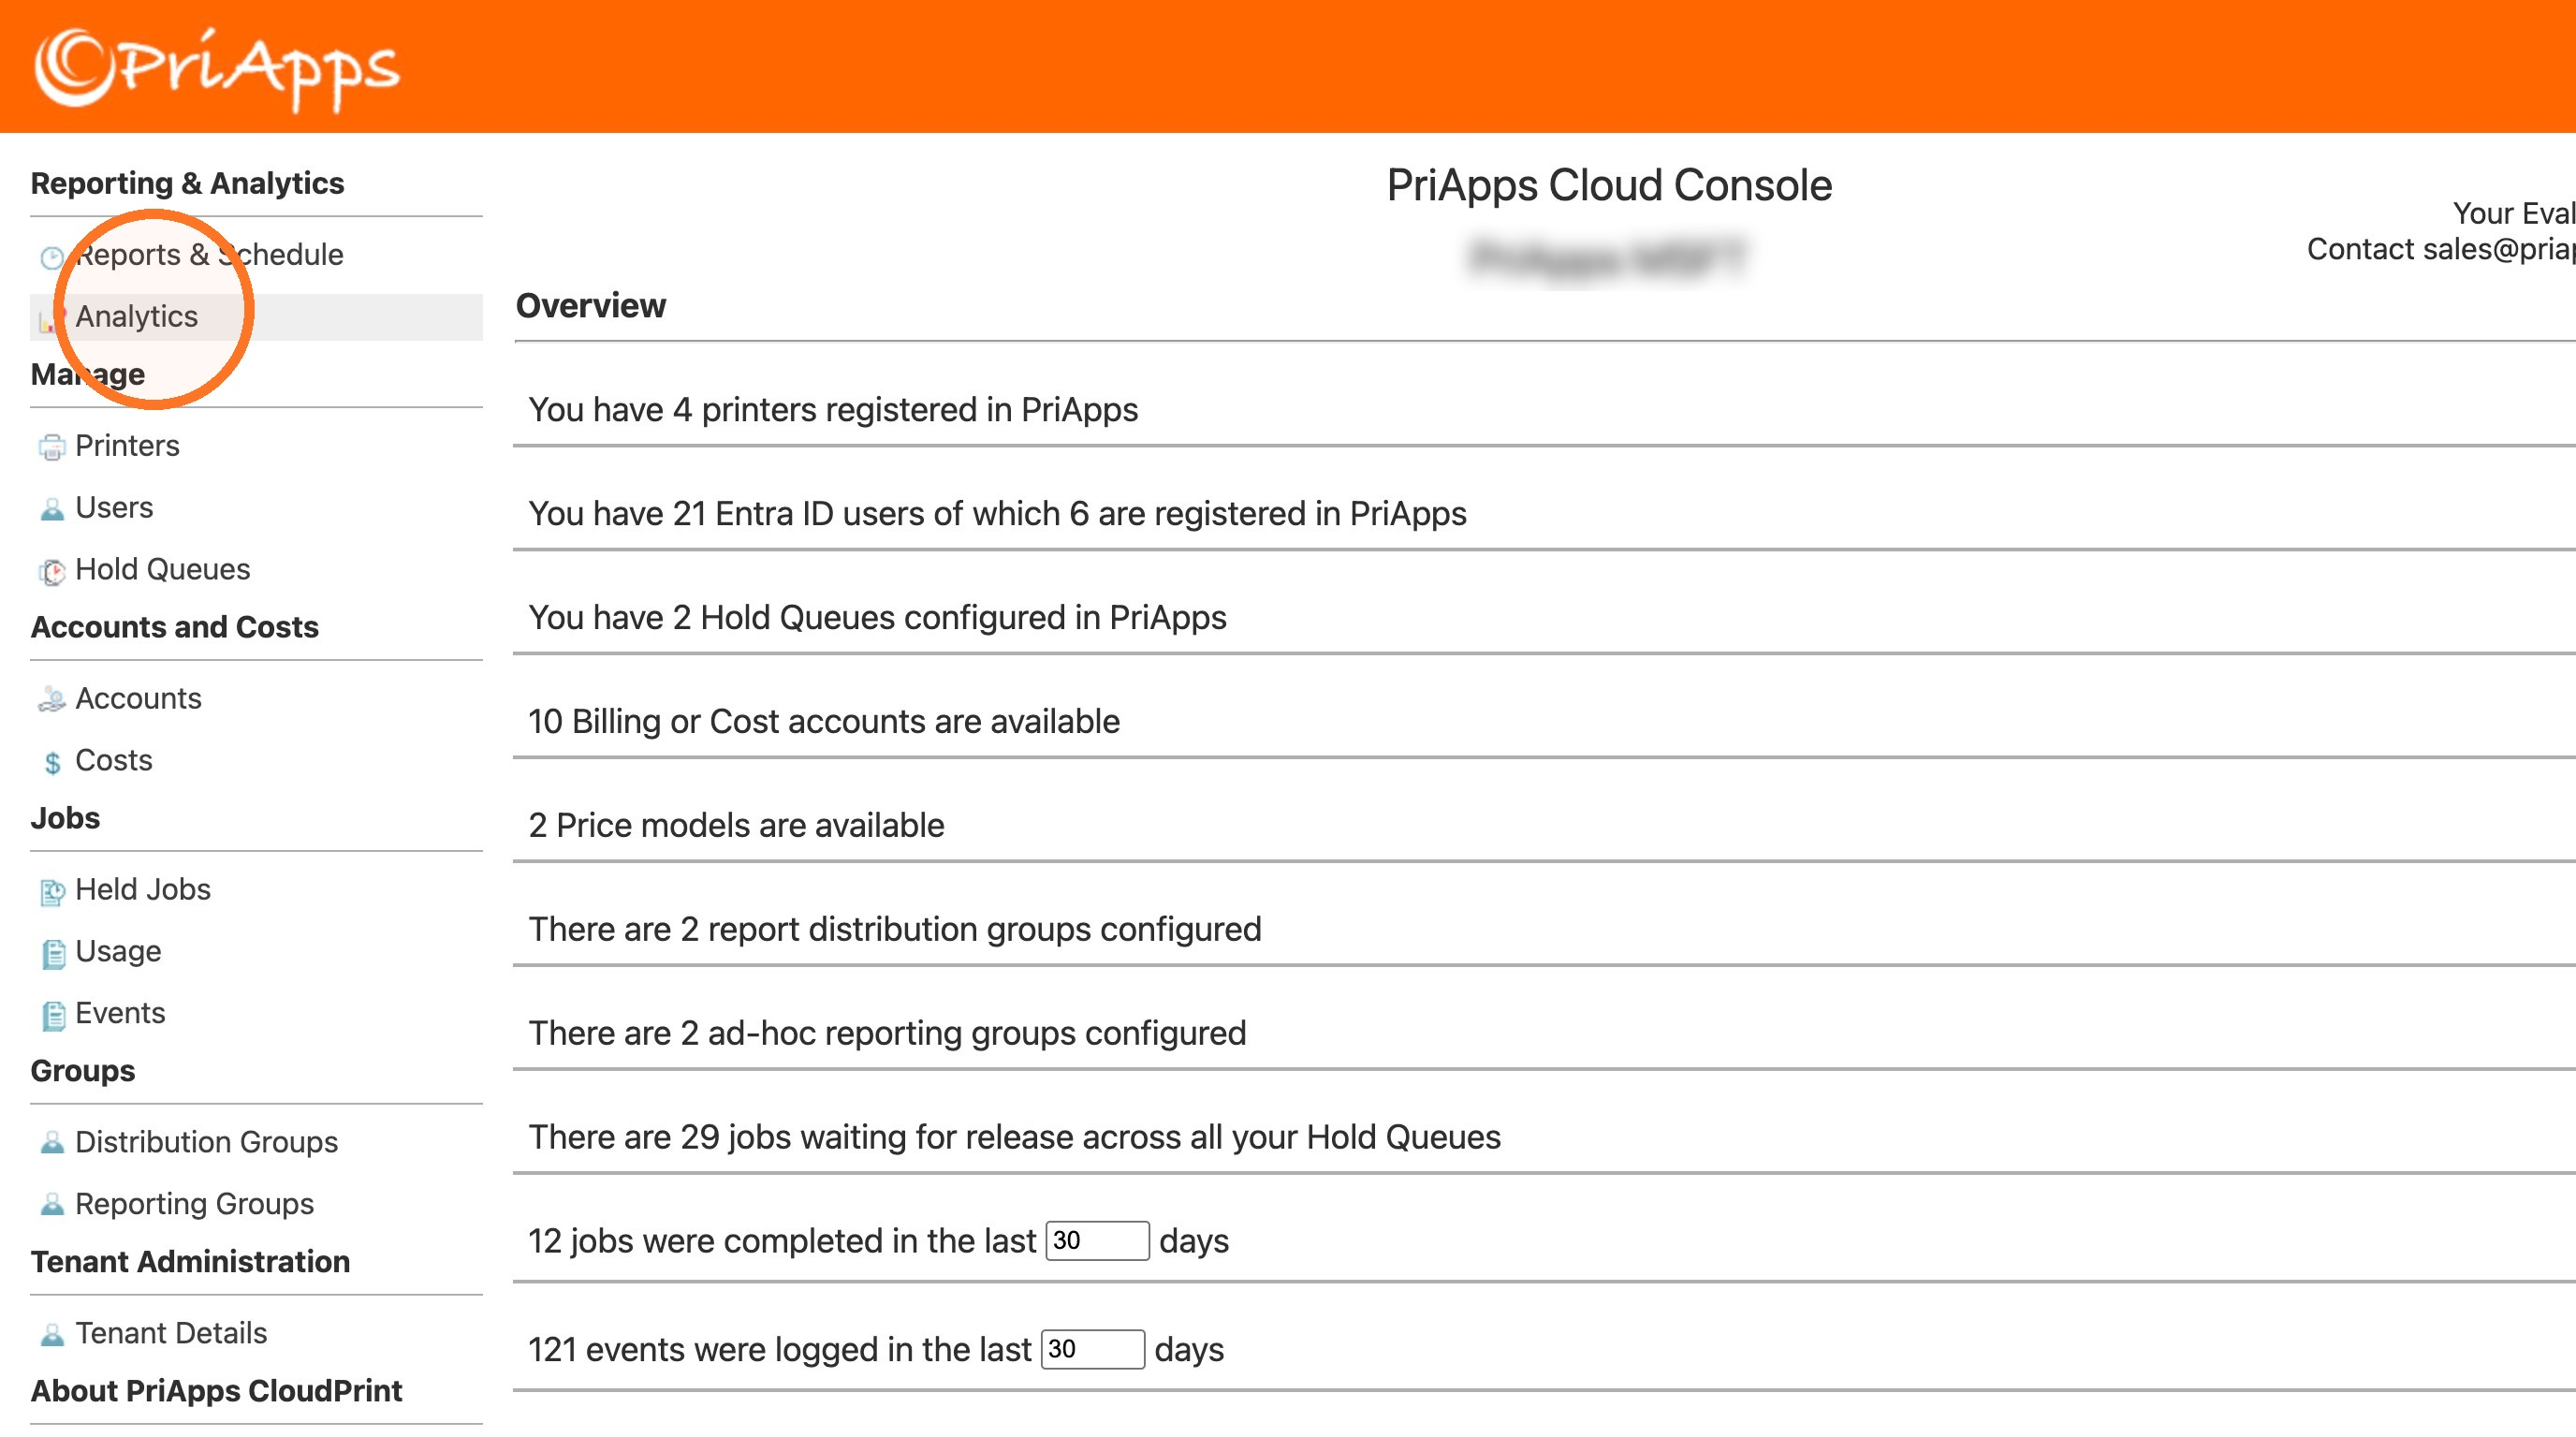
In the menu, under Reporting & Analytics, select Analytics.
Add charts and reports
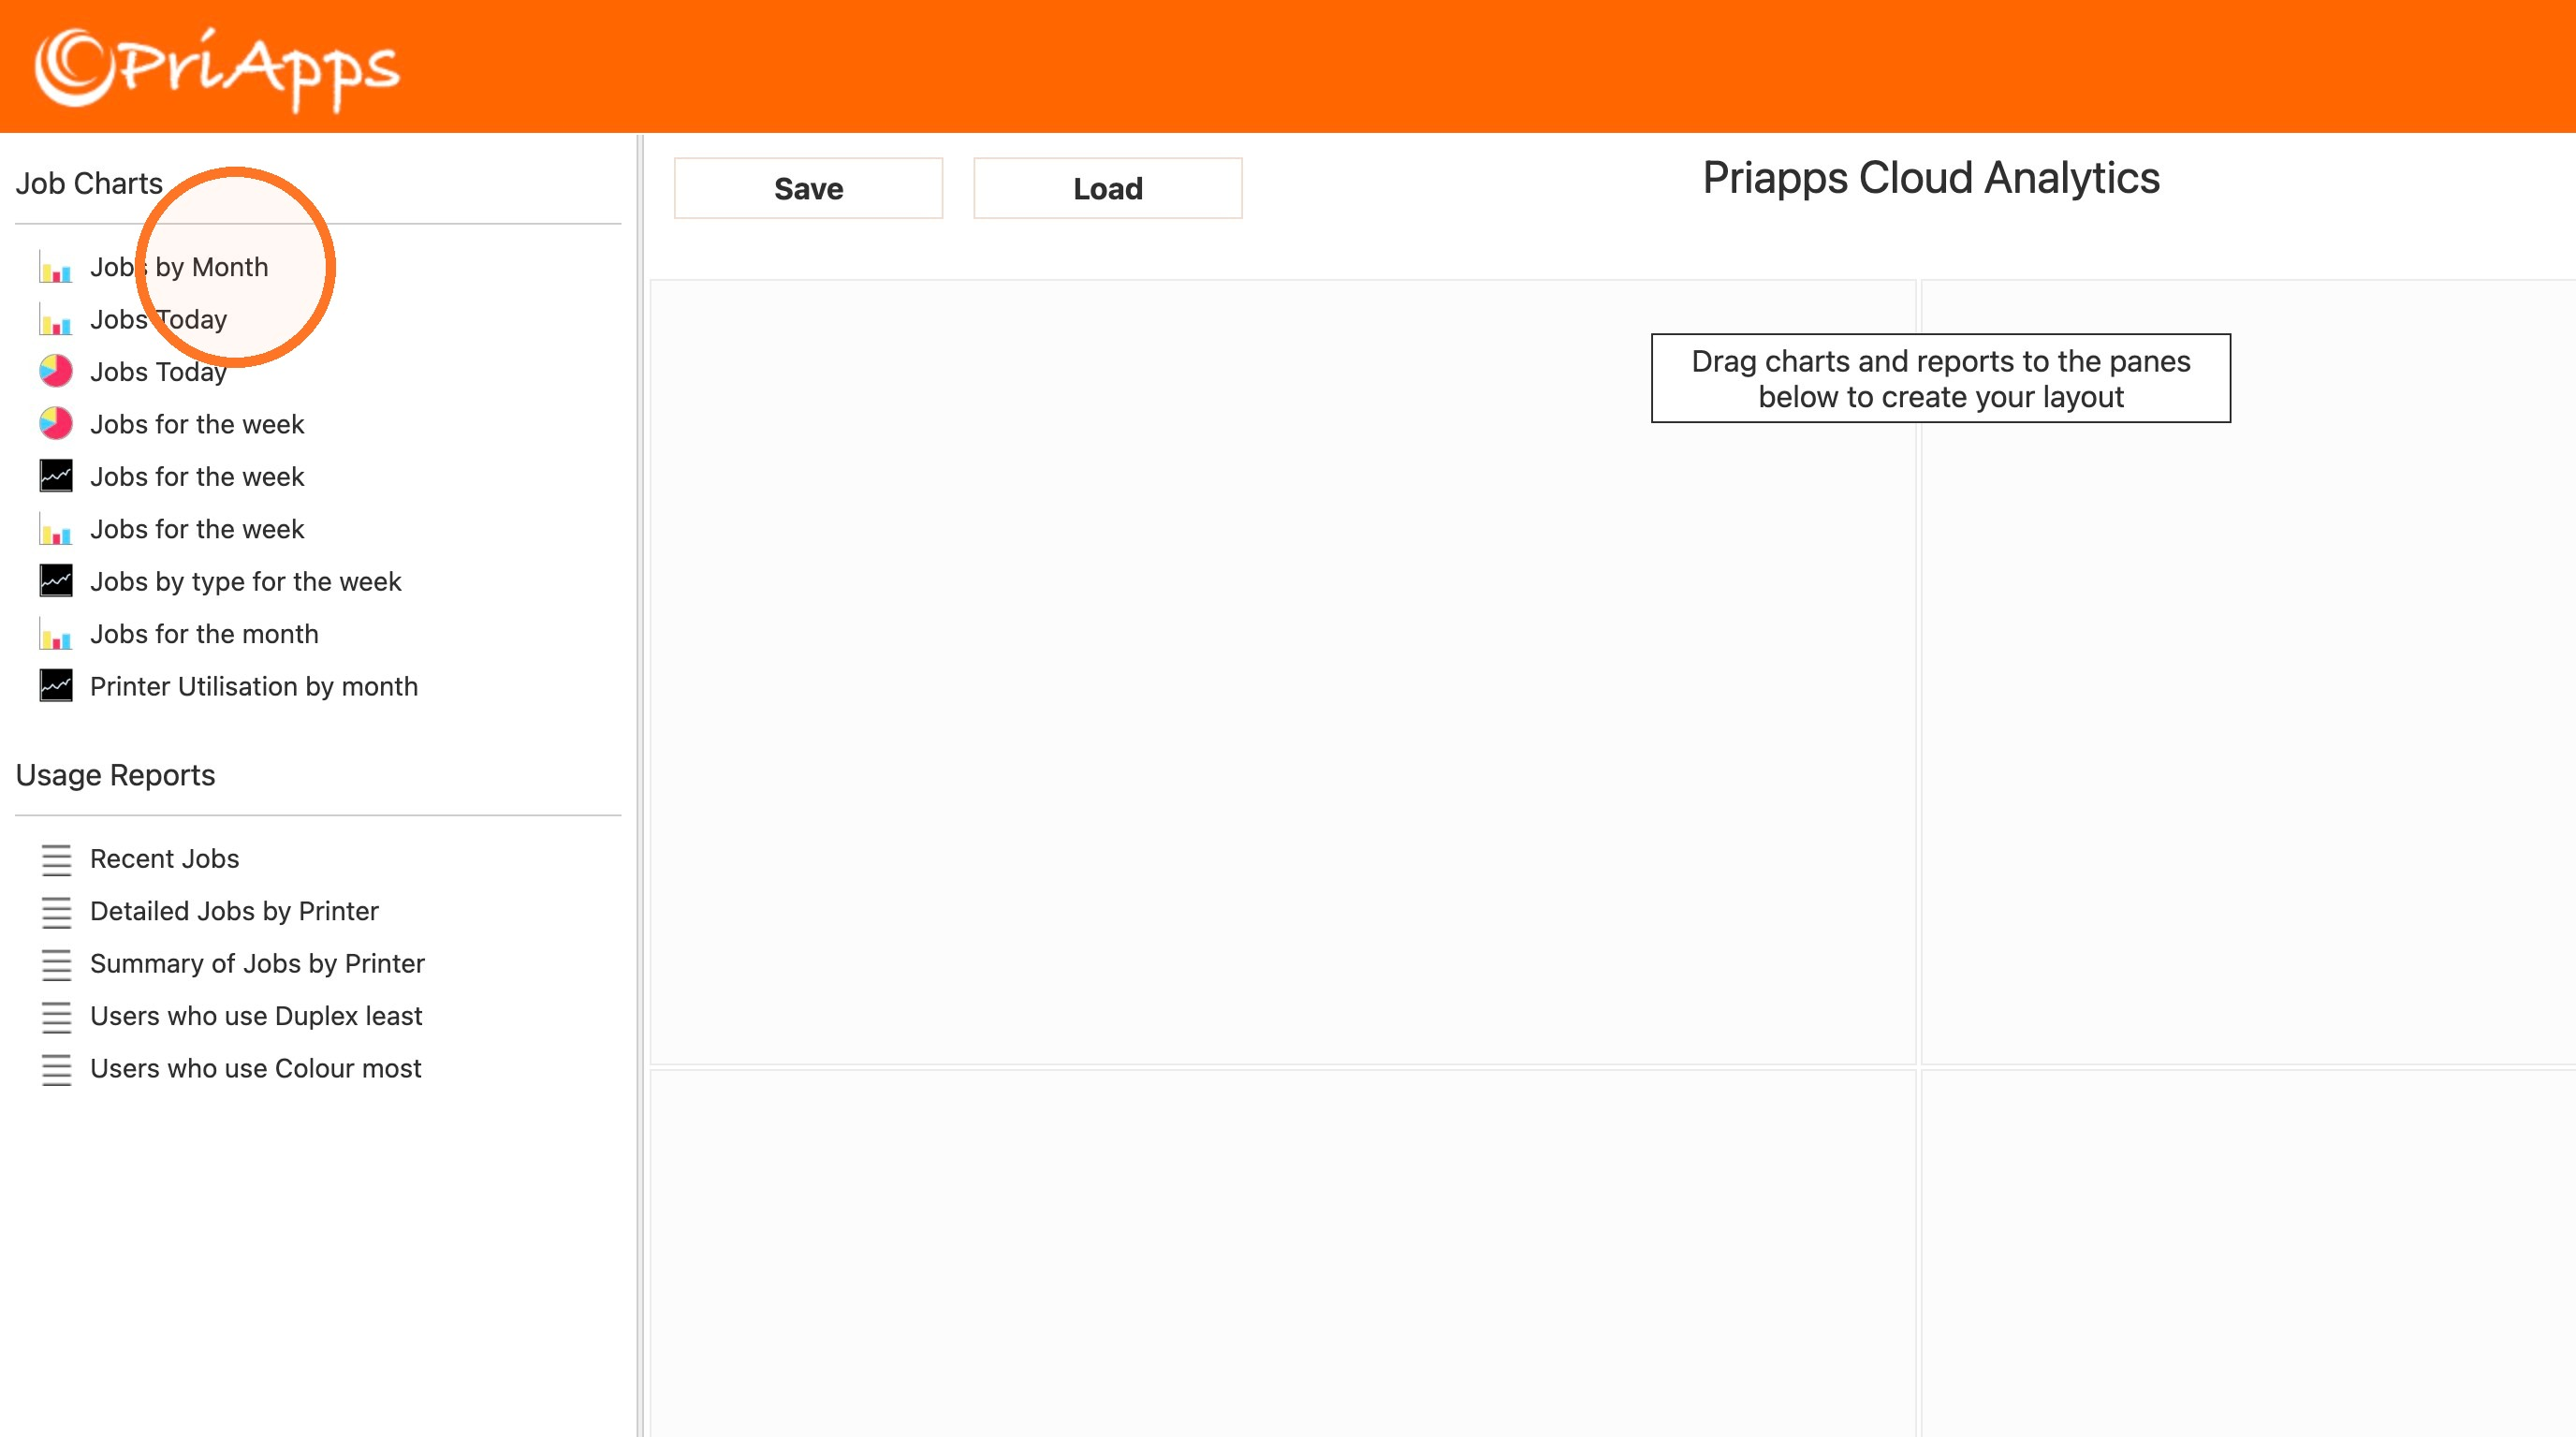
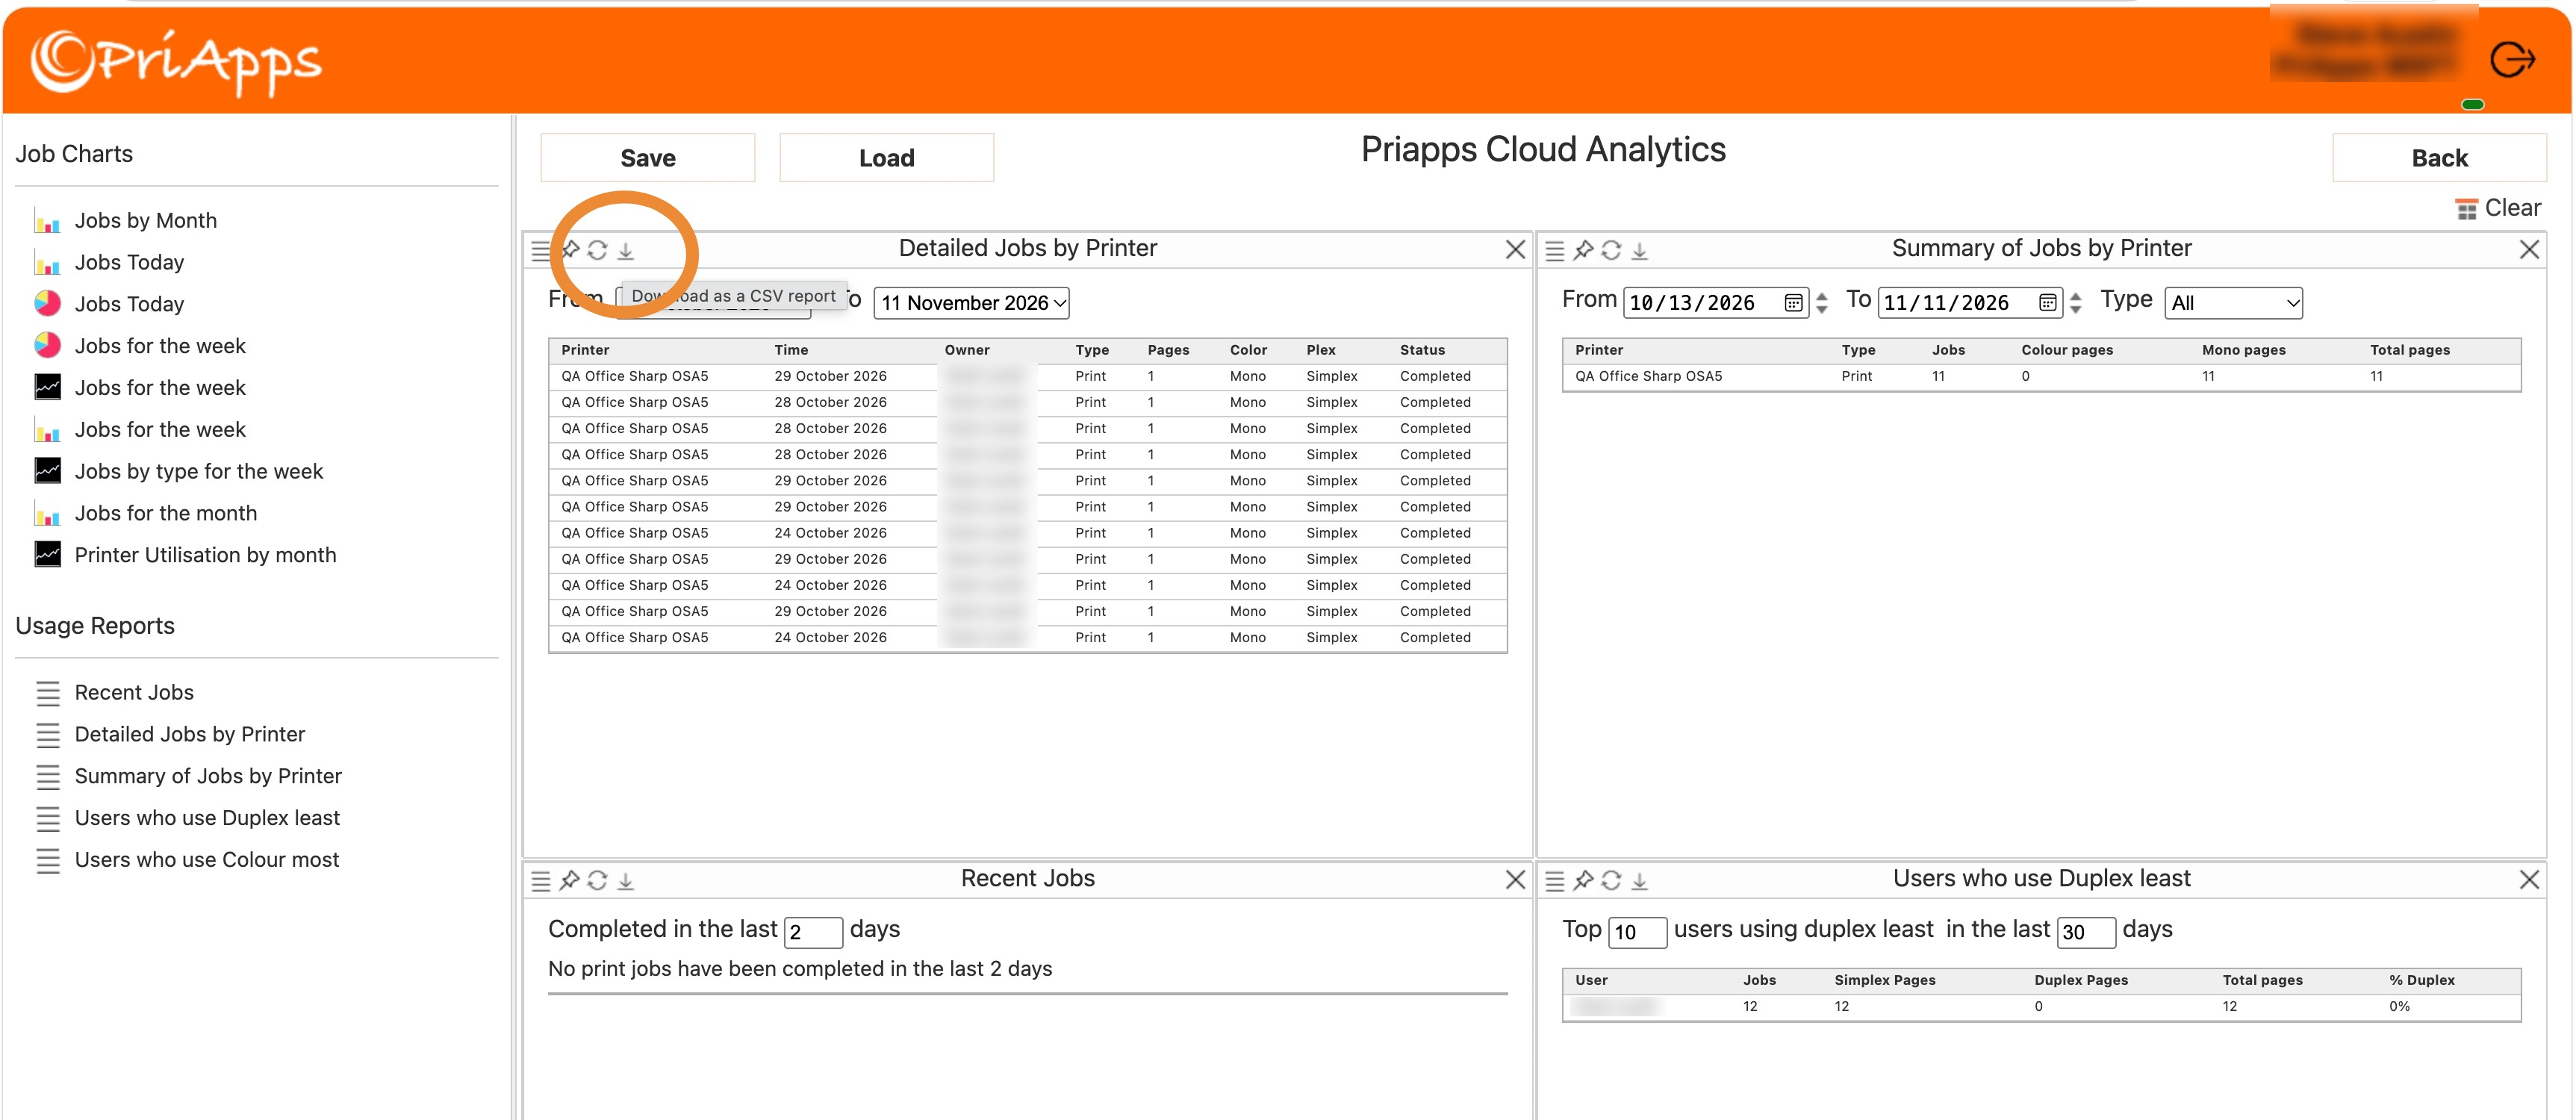
Drag a chart from Job Charts, or a report from Usage Reports, into one of the four panes on the right. See Charts and Usage reports.
Change the settings
In each chart or report, change settings such as the dates or the Type of job. The chart or report updates straight away.
Save the dashboard
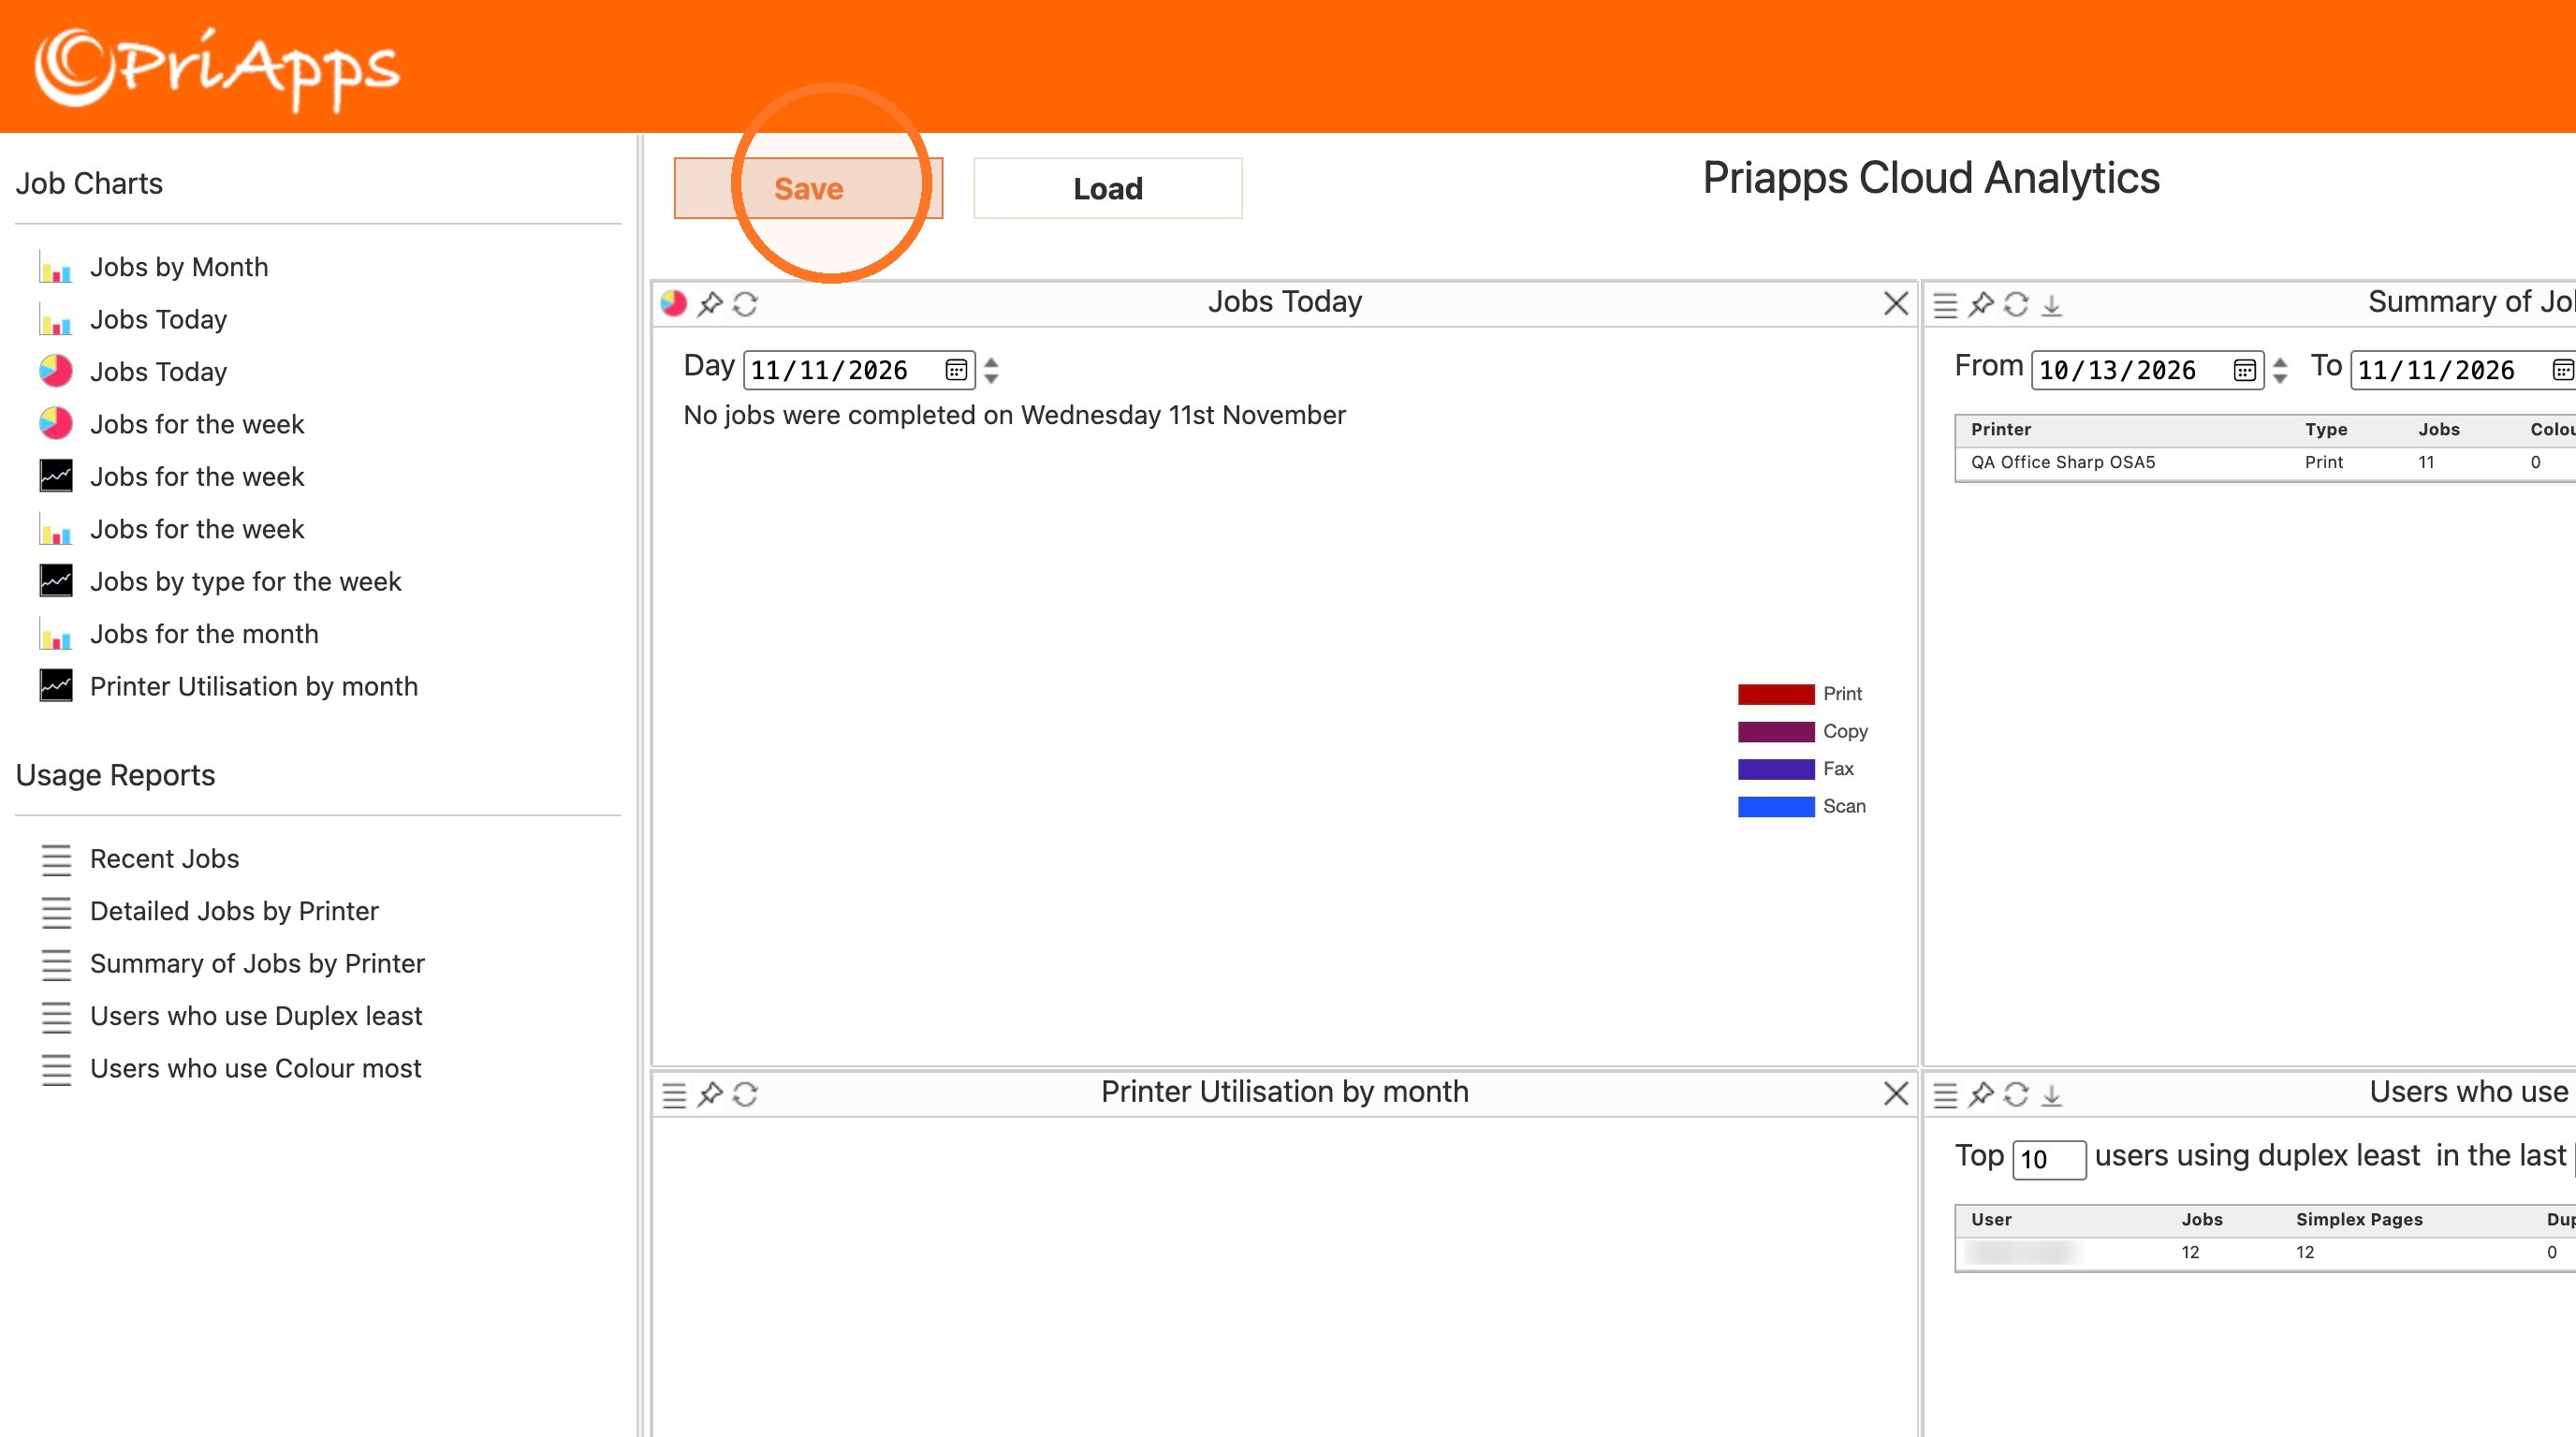
Select Save to keep this dashboard. You can save more than one, and every admin in your organization can open the dashboards you save. To open a saved dashboard, select Load.
Change your dashboard
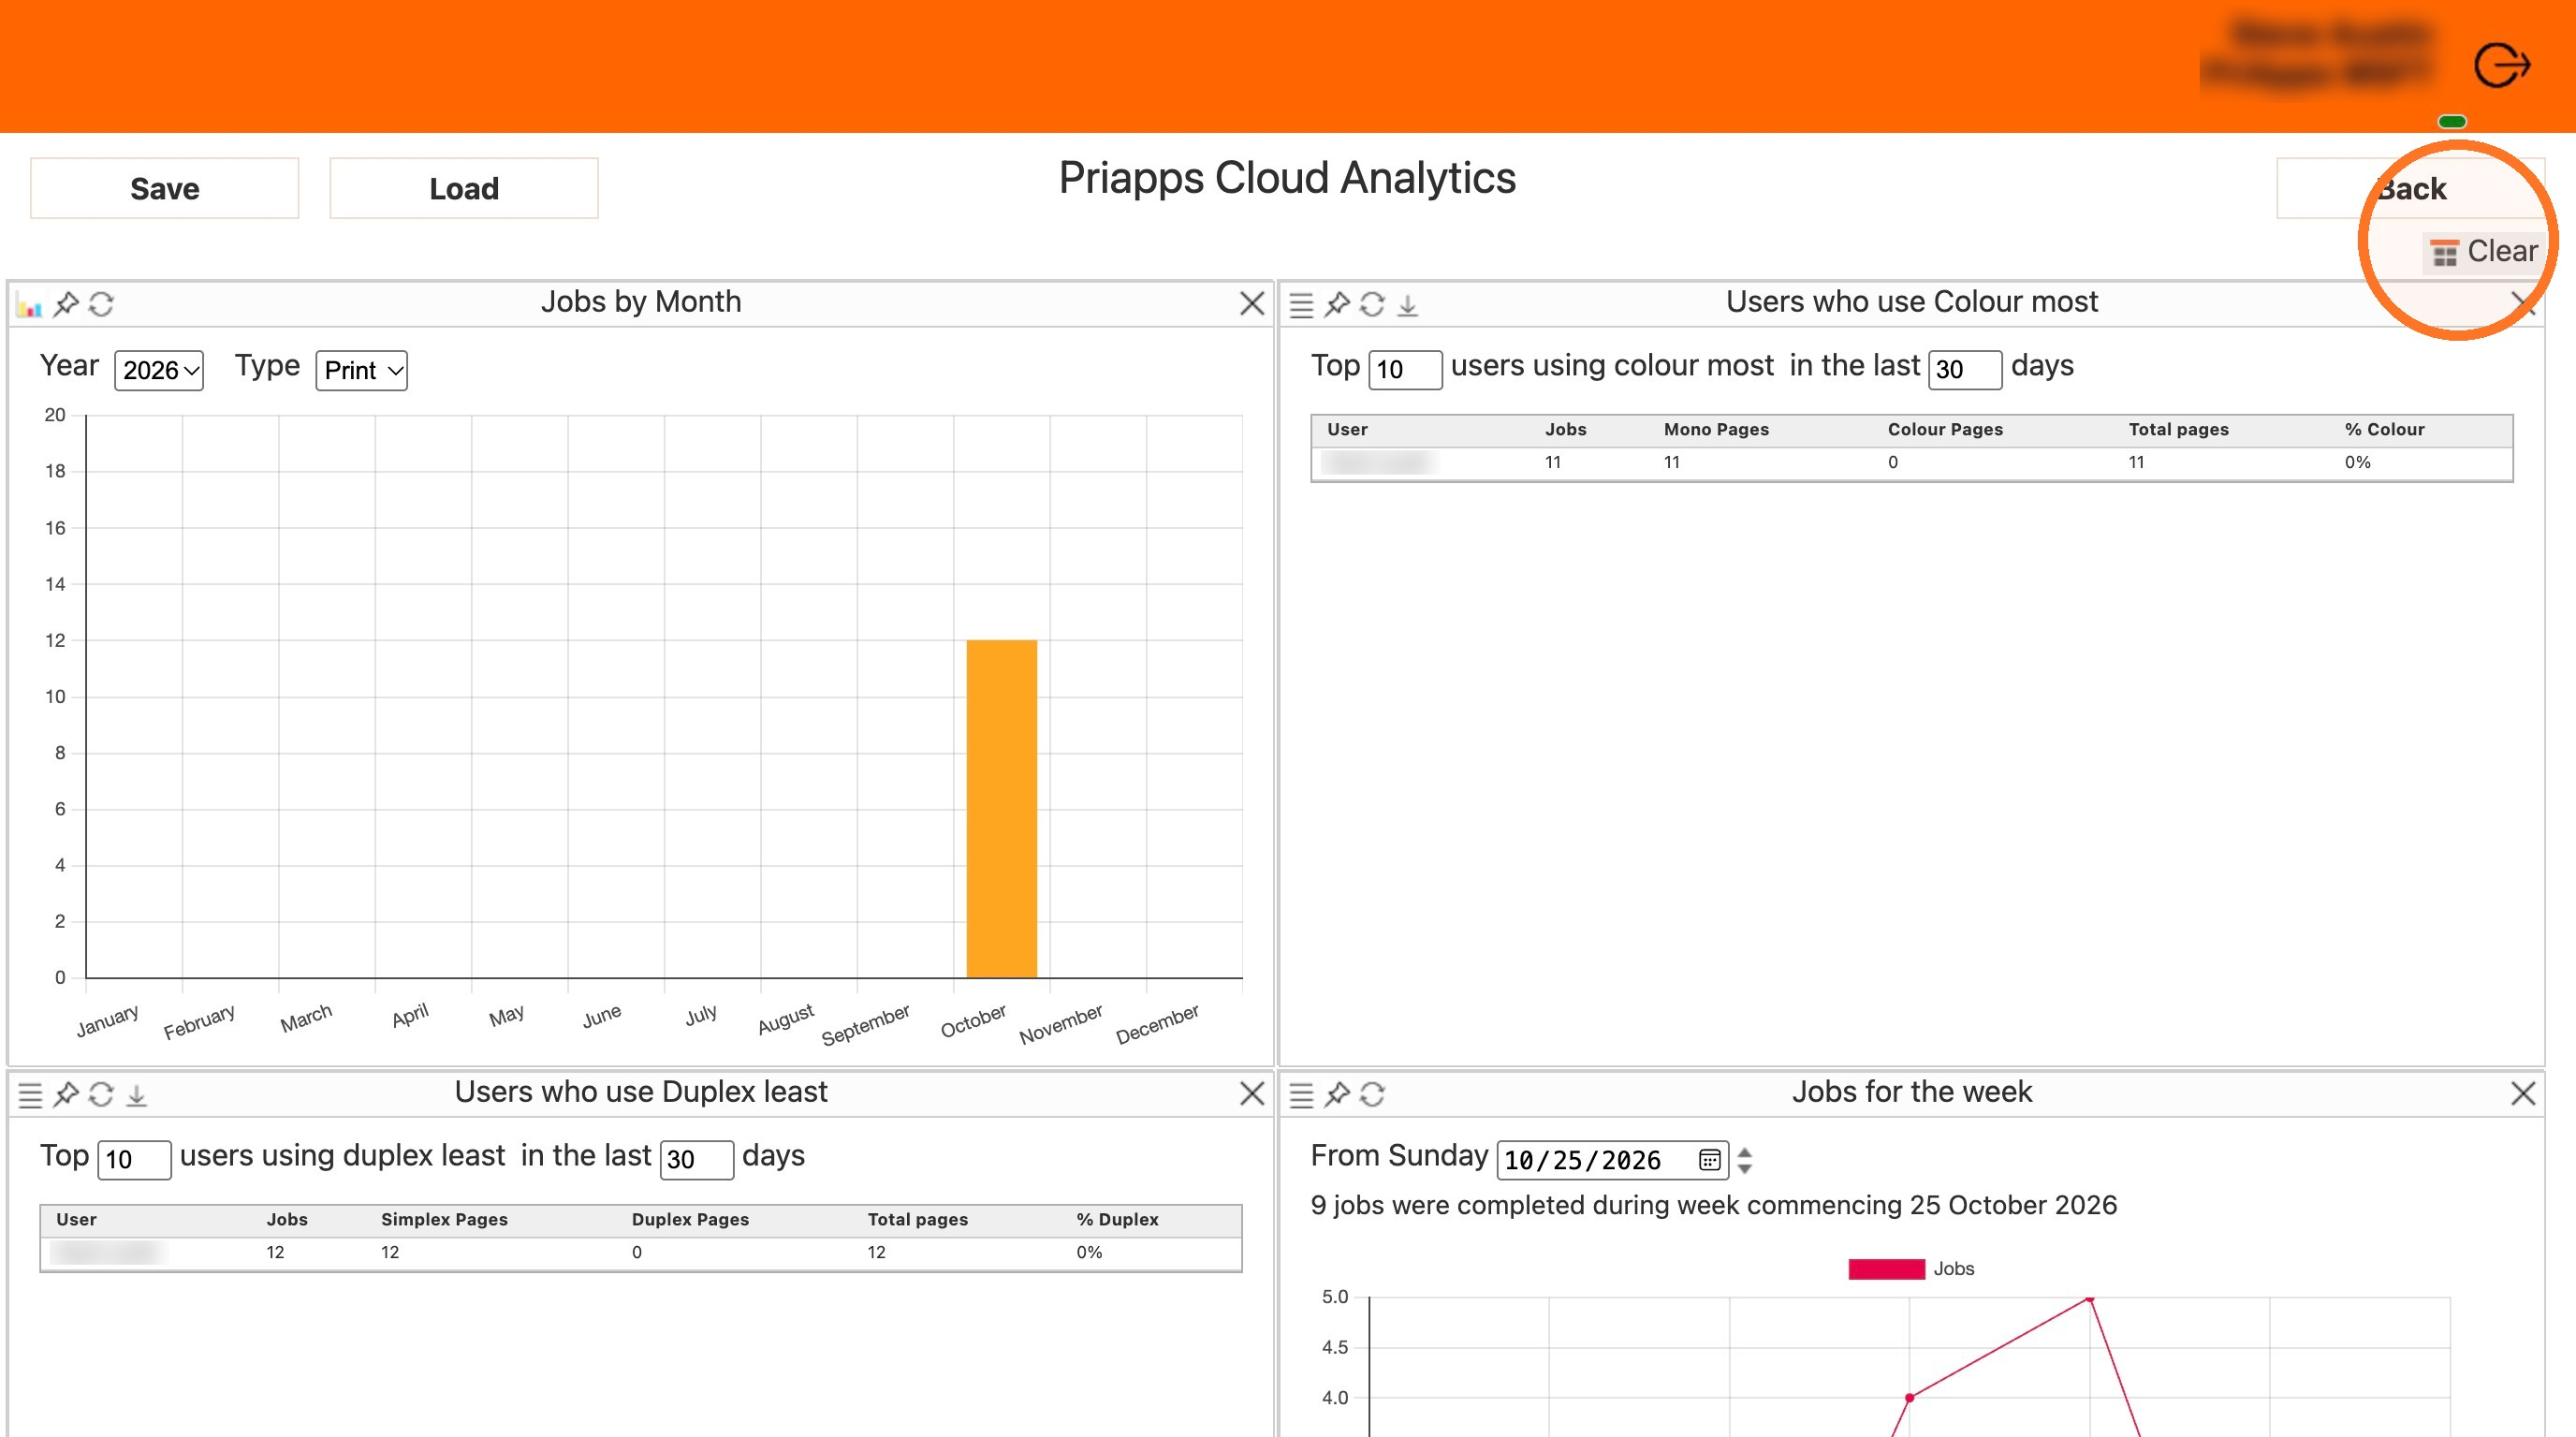
To remove a chart or report, select the X at its top right. To remove them all, select Clear.
Download a usage report
At the top left of a usage report, select the download icon. The report is saved as a CSV file in your downloads folder, and a message shows the file's name.
Charts
| Chart | What it shows |
|---|---|
| Jobs by Month (bar chart) | Jobs for each month of the current year. It shows print jobs at first; you can change the Type to copy, scan or fax, and change the year. |
| Jobs Today (bar chart) | Today's jobs by type. You can change the day. |
| Jobs Today (pie chart) | Today's jobs by type. You can change the day. |
| Jobs for the week (pie chart) | This week's jobs by type. You can change the week. |
| Jobs for the week (line graph) | This week's total jobs. You can change the week. |
| Jobs for the week (bar chart) | This week's total jobs. You can change the week. |
| Jobs by type for the week (line graph) | This week's jobs by type. You can change the week. |
| Jobs for the month (bar chart) | This month's total jobs. You can change the month. |
Usage reports
| Usage report | What it lists |
|---|---|
| Recent Jobs | Jobs completed recently, by date. You can change how many days it covers. |
| Detailed Jobs by Printer | Each job on each printer within a date range. You can change the dates. |
| Summary of Jobs by Printer | A summary of the jobs on each printer. You can change the dates and the Type. |
| Users who use Duplex least | The users who print on both sides of the page least. You can change how many users are listed and how many days it covers. |
| Users who use Colour most | The users who print in color most. You can change how many users are listed and how many days it covers. |
Related articles
Report scheduling
Schedule usage and cost reports to be sent to a distribution group as PDF or CSV files, once or on a regular schedule.
Reporting groups
Group users and printers for reporting, and choose the price model used to cost their usage.
Distribution groups
Create distribution groups and choose their members, so you can send ad hoc and scheduled reports to the right people.